I’ve been running a NodeJS server for a web application for over a year now, and while NodeJS has some strengths, I’m finding it has a weakness in the realm of memory management. I’ve never had an Apache or Nginx server run out of memory quite like NodeJS does.
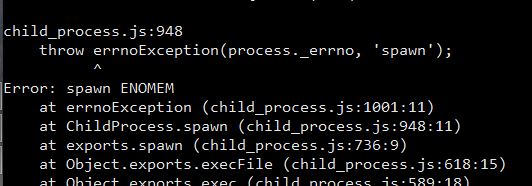
There’s nothing worse than coming into work and seeing in my NodeJS logs the dreaded ENOMEM error… I believe ENOMEM simply stands for “Error – No Memory”.
Once upon a time my NodeJS server was on a shared server as another web server and such, and thus I figured there was just a conflict for resources. However I’m now running on a dedicated Ubuntu server. It only has 2GB of RAM, but really this should be sufficient for the web application.
Contents
Tracking Down a Memory Leak
The first step to solving a problem is identifying the problem. For that, you need to have some insight though as to what is happening in your code. So to look at memory usage, you can simply add this to your scripts to log out the memory usage.
1 2 | console<span class="sh_symbol">.</span><span class="sh_function">log</span><span class="sh_symbol">(</span>util<span class="sh_symbol">.</span><span class="sh_function">inspect</span><span class="sh_symbol">(</span>process<span class="sh_symbol">.</span><span class="sh_function">memoryUsage</span><span class="sh_symbol">()));</span> |
This will output a message that looks something like:
1 | { rss: 51998720, heapTotal: 47029936, heapUsed: 29999680 } |
These three numbers relate to your memory usage:
- rss
- Resident Set Size
- This is the number you should be most interested in.
- This is how much memory your NodeJS application is currently using.
- heapTotal
- Refers to v8’s (JavasScript Engine) underlying storage
- It’s my understanding that this number is the amount of RAM allocated to your NodeJS server.
- heapUsed
- Refers to v8’s (JavasScript Engine) underlying storage
- It’s my understanding that this is the amount of the heapTotal being used currently
I like to throw this logging message all over my script – particularly before and after variable or processes that I know should be large and would assumingly take up a lot of memory. Restart your NodeJS server, run the application a bit and monitor the rss number. In my case, the rss was continuing to go up but never come down. As you can assume, once you use up too much memory, the server will run out and you will find your friend the ENOMEM soon enough.
I like to copy down the numbers I’m seeing here so that as I go through and try to do some cleanup I can notice the difference. I write down the initial rss number as well as a number after running the application a say three times or so. This becomes my benchmark and my standard testing procedure for future tests.
Clear Your Variable
A good programming practice and something that may help in this scenario is to clear your variables when you are done with them. In other-words, put your dishes in the dishwasher when you are done eating and you won’t have a messy kitchen. (sorry for the weird reference to one of my other passions – food) So if you have this:
1 2 | var reallyLargeVariable = "an extreeeeeeeeeeeemly long string....... and more data here..... and even more here..."; |
and at some point you no longer need that variable, like when your process has completed, then you should follow it with something like this:
1 2 | reallyLargeVariable = ""; OR reallyLargeVariable = NULL; |
Try doing this, add the memory logger mentioned above, re-start NodeJS and re-run your application and see if this made a difference. If all goes well you should see something of a difference from your first tests in that your rss numbers should stay lower than before.
Forcing Garbage Collection
In my experience, clearing my variables still didn’t seem to be the magic bullet. So I went one step further.
Like other programming languages, NodeJS and v8 do have a garbage collection process that should run from time to time to clear unused memory. However as you may have found in your research, this is a weakness of the NodeJS and v8 combination. For whatever reason garbage collection doesn’t seem to run often enough.
It is possible in NodeJS to force garbage collection to run, but it takes a few steps. The most important step is to run your NodeJS server with garbage collection exposed. To do that, you need to add the expose garbage collection flag when you start NodeJS.
1 | node --expose-gc myServer.js |
I personally use forever to ensure that the server stays up if it were to crash. If you use that as well, you would instead use the command. Subsequent restarts will respect the expose garbage collection command.
1 | forever start -c "node --expose-gc" myServer.js |
Now that we are up and running with manual garbage collection enabled, you just need to call it in your scripts. To do that, simply call:
1 | global.gc(); |
Run Garbage Collection Function
I personally use this function to trigger garbage collection.
1 2 3 4 5 6 7 | function runGC() { if( typeof global.gc != "undefined" ){ // console.log("Mem Usage Pre-GC "+util.inspect(process.memoryUsage())); global.gc(); // console.log("Mem Usage Post-GC "+util.inspect(process.memoryUsage())); } } |
This function also checks to see that your server is running with garbage collection exposed, thus preventing issues if you don’t start that way. Also, I’ve built the memory logging into this function that I un-comment when I need to do further testing and debugging.
Calling this in your code, simply use:
1 2 | runGC(); |
Summary
While NodeJS and v8 are powerful tools, they seem to be lacking in memory management and at times require some manual effort to ensure that your server doesn’t crash due to running out of memory (ENOMEM). Clearing unused variables and manually running garbage collection are two great methods to accomplish this task.
Update – Finding More Memory Leaks
After writing this post I continued to monitor my server and found that there were still further memory leaks. After digging through the code more, I did find another deeper issue – you can read all about on this article. Node JS Fabric JS Memory Leaks – Prevent ENOMEM